Aerial view of a high-rise construction site in a city during winter with cranes, unfinished buildings, and snow-covered ground.

Realtime workforce

Visibility, productivity and safety

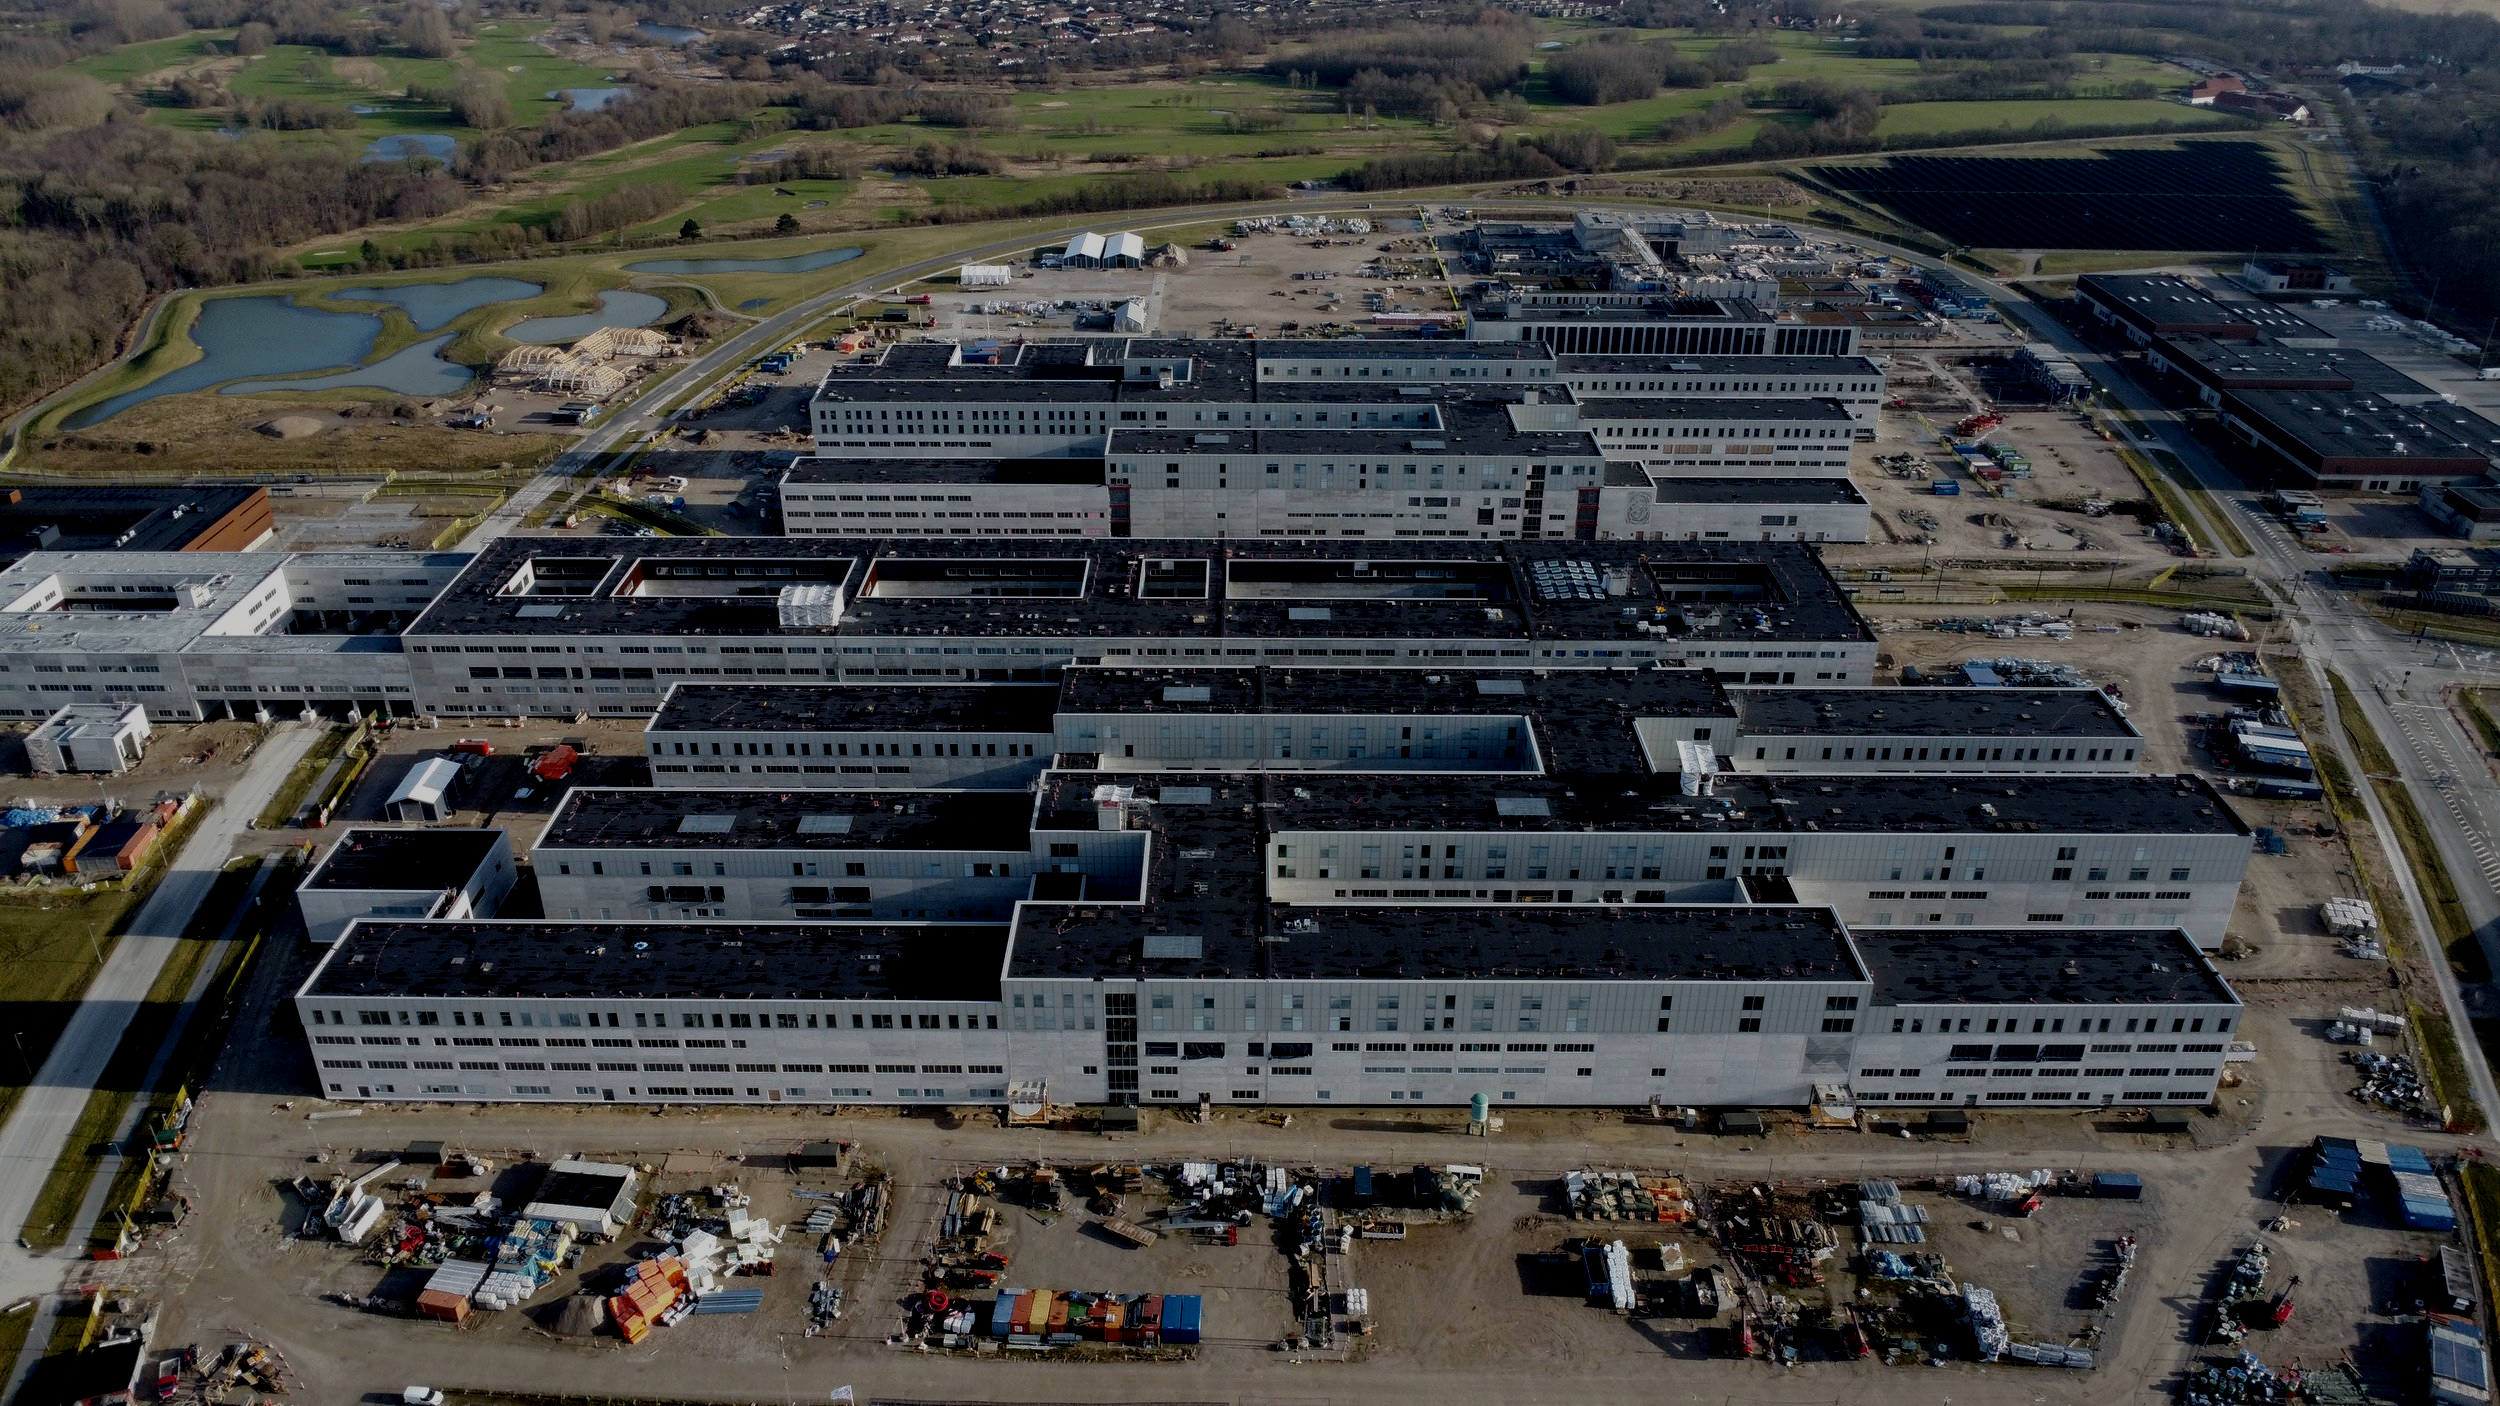
Managing construction sites means dealing with safety risks, inefficiencies, and constant change.

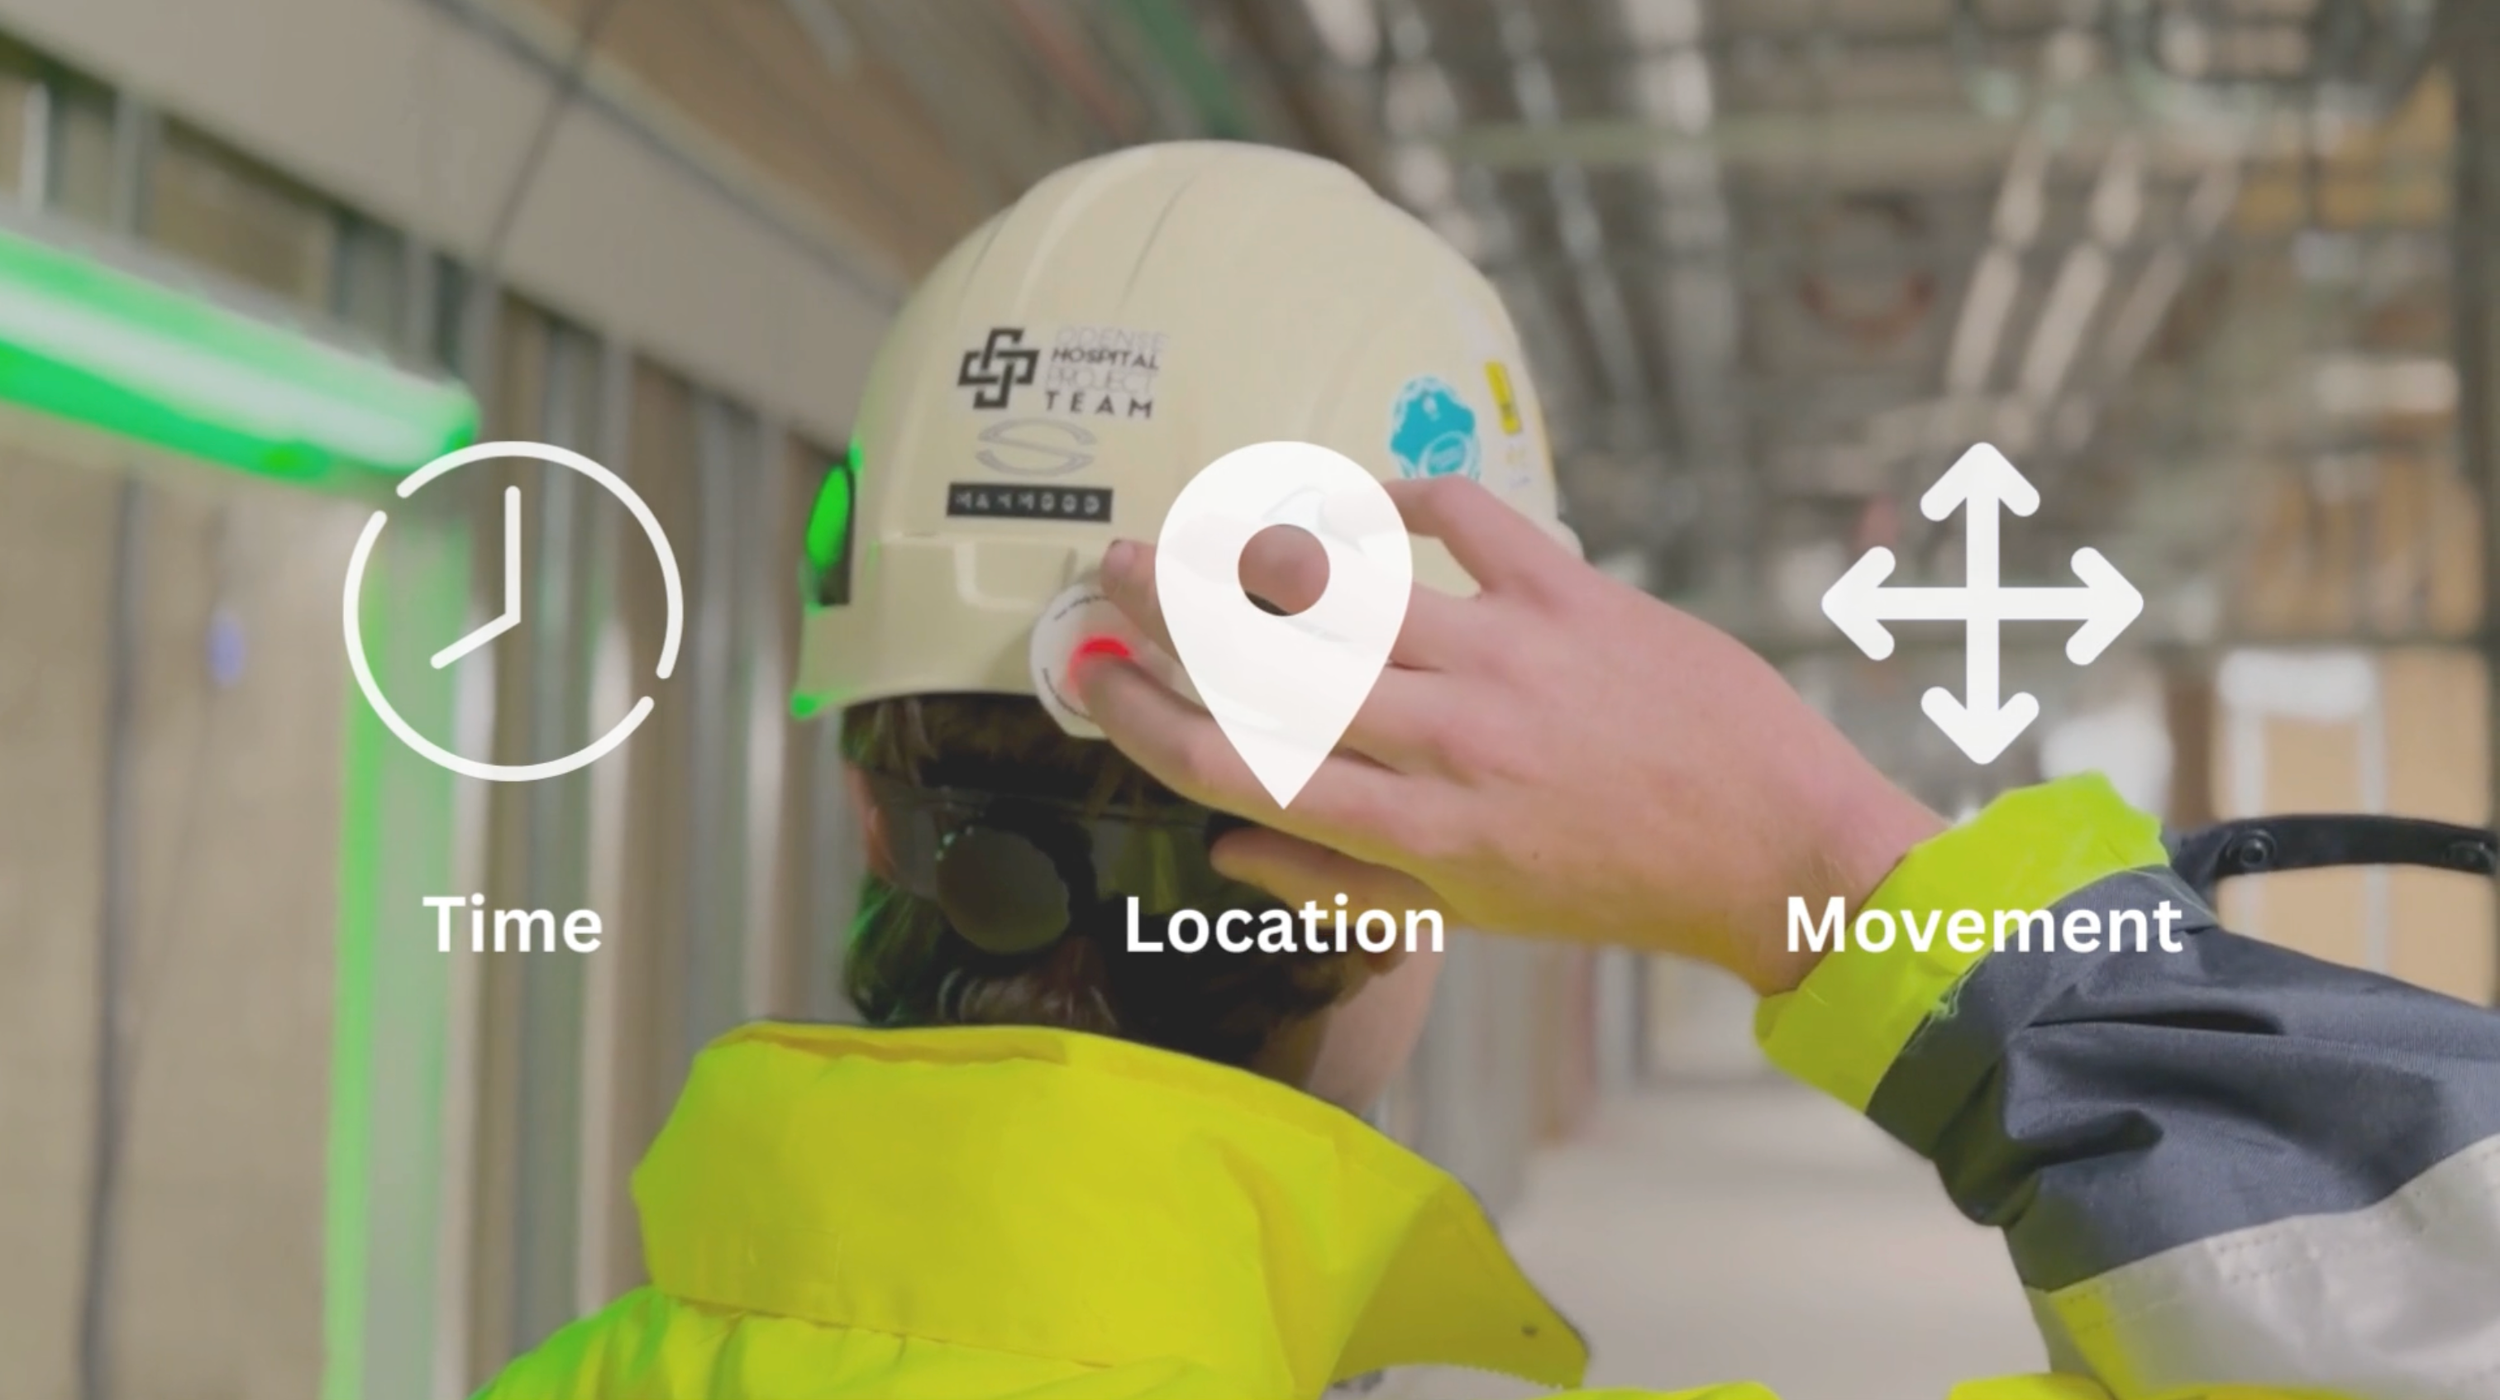
TokenMe gives you realtime visibility into your workforce, equipment, and environmental conditions.

Illustration of a construction site showing two buildings at different stages, with workers and equipment. The image features numbered steps for installing anchors and equipping workers with tokens, with GPS-like location markers on the buildings indicating Zone 1 and Zone 2. There is a crane, a small excavator, and construction materials.

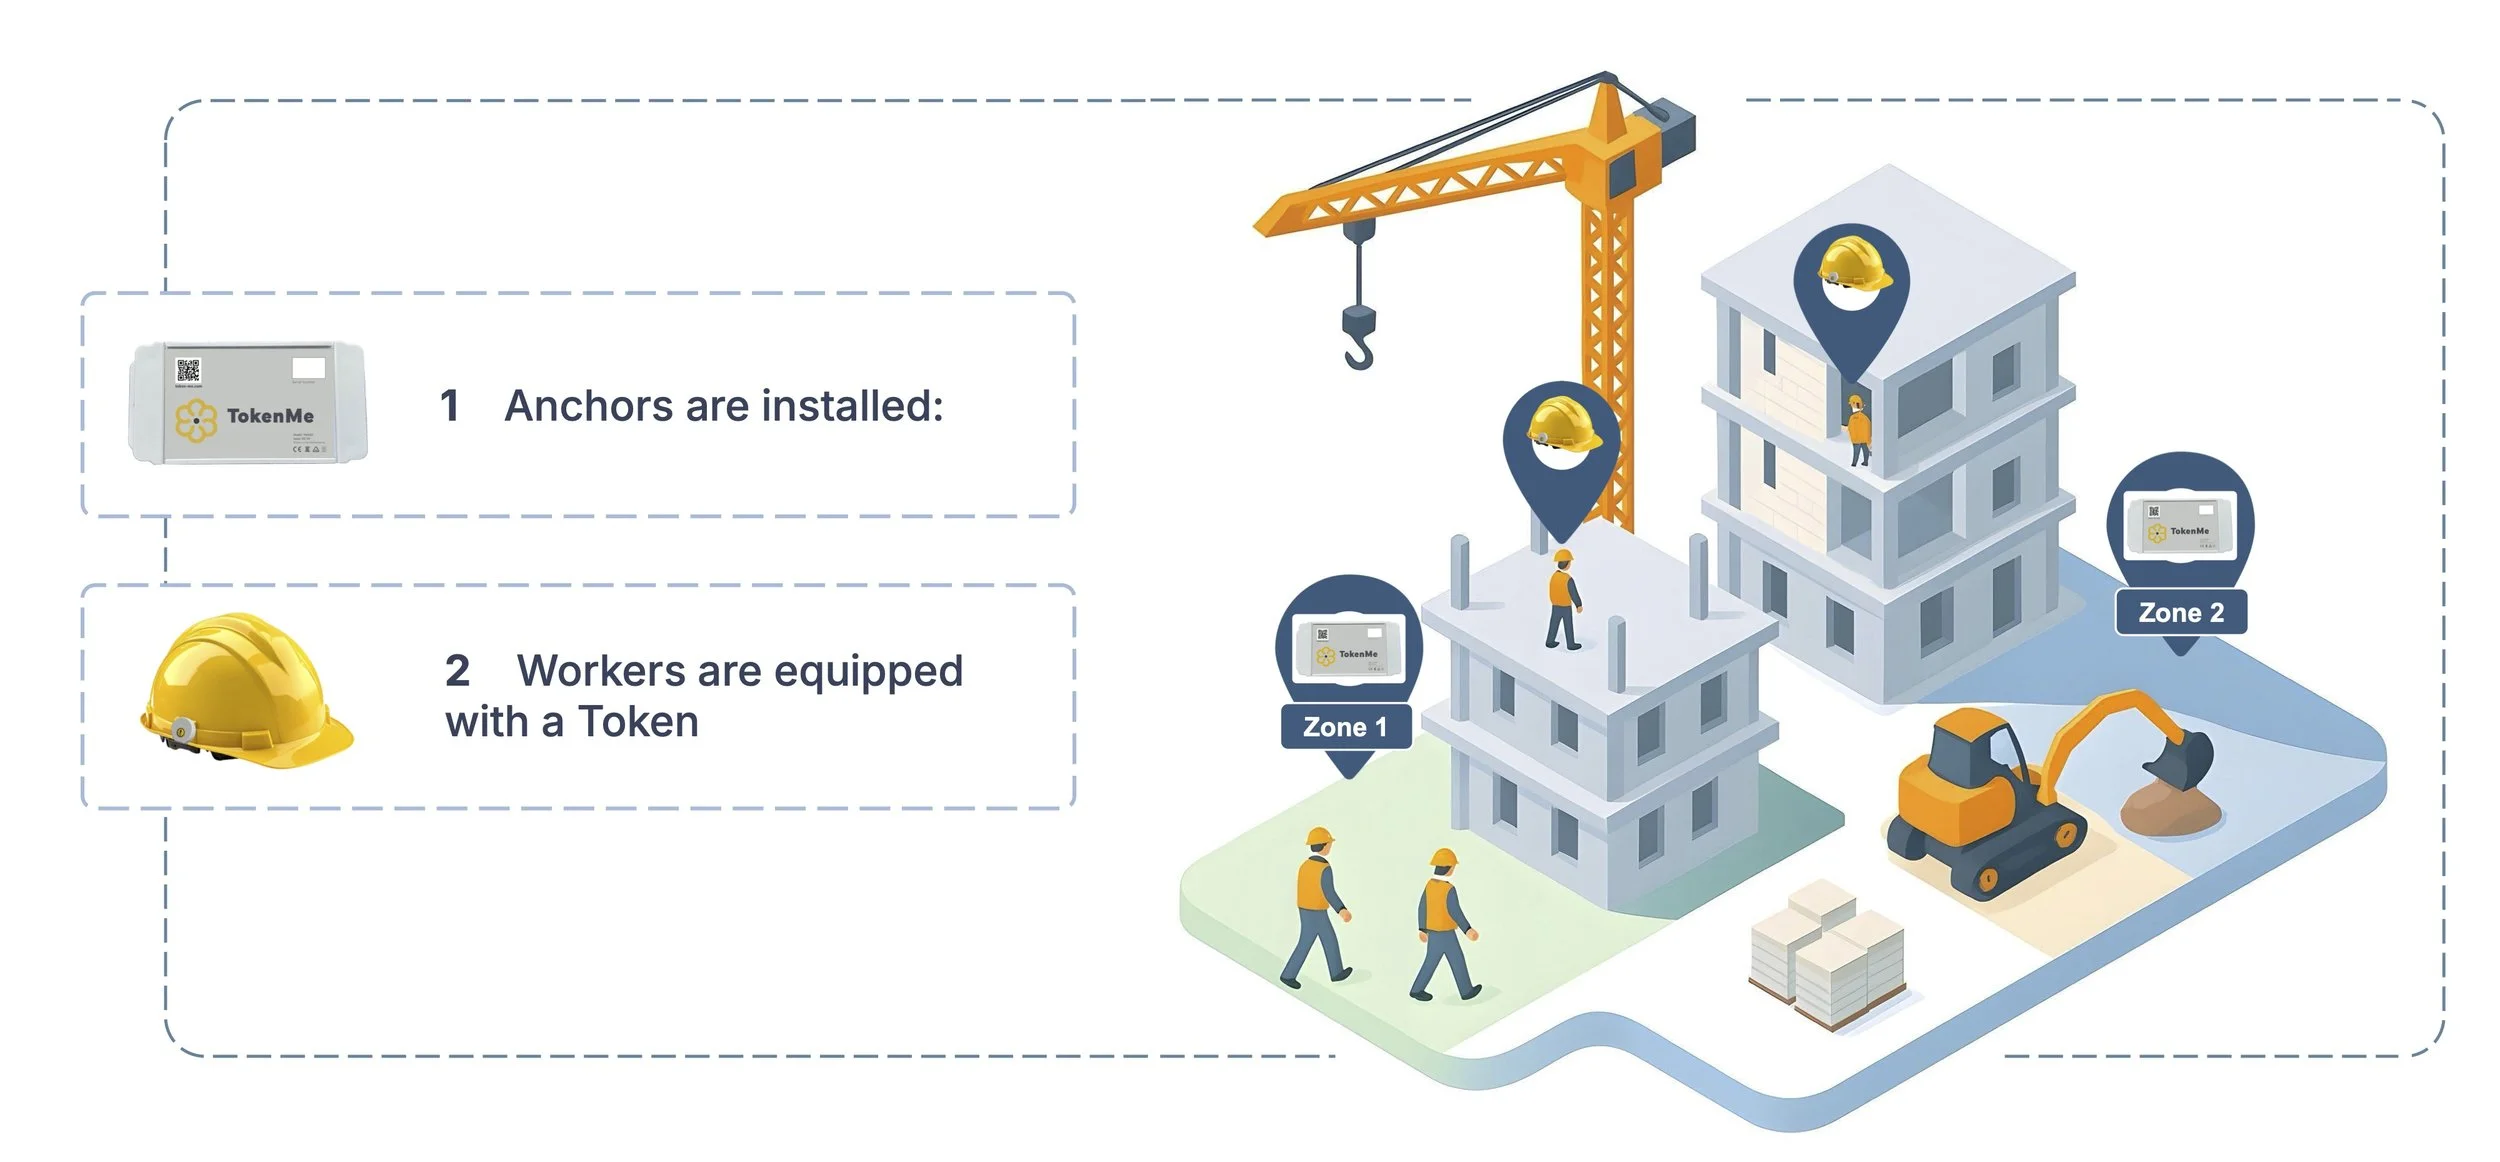
Wireless anchors and wearable smart tokens communicate to detect presence of workers, and site conditions.

Diagram showing a yellow hard hat with a wearable token attached, connecting via UWB to a wireless anchor, which communicates through a cloud to a computer displaying real-time dashboards and historical insights.

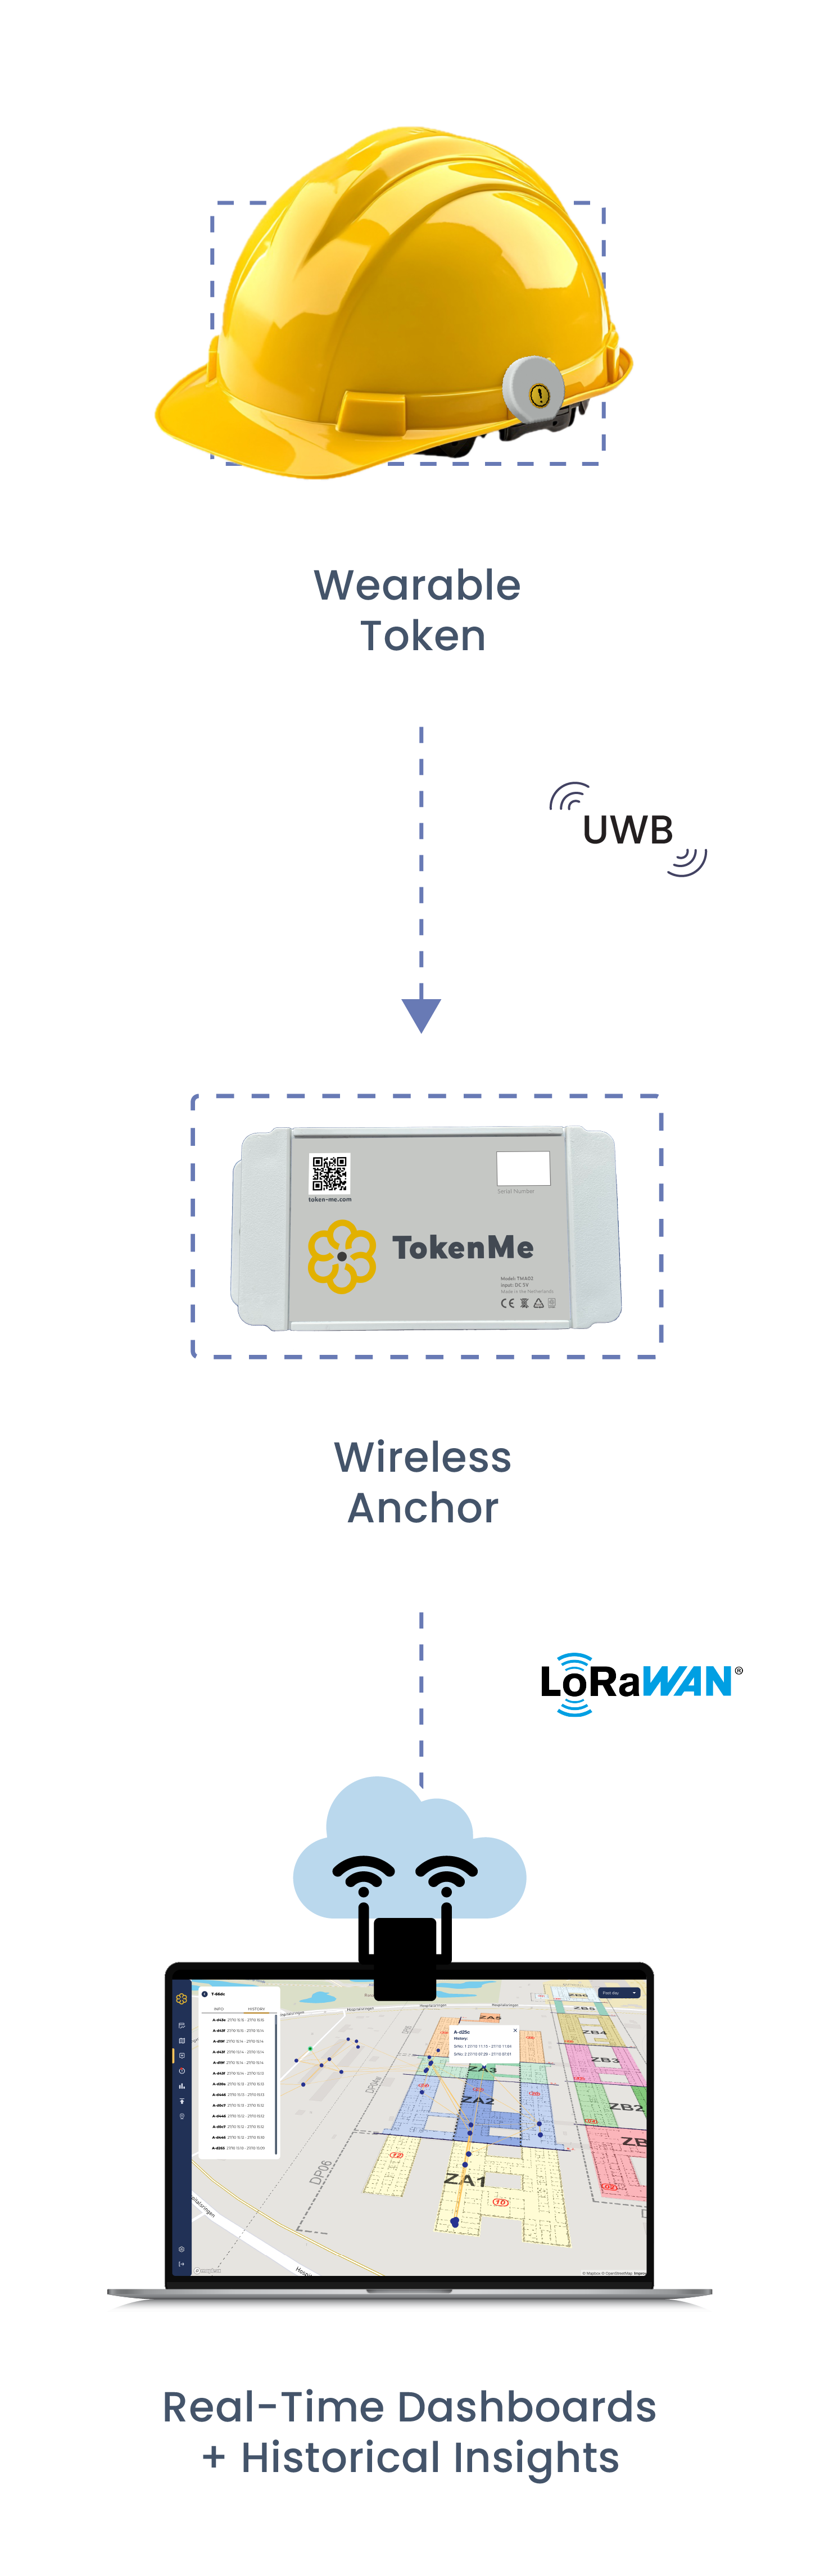
Reliable through concrete, steel, dust, long distances and life that lasts for years.

Contact Expert
A laptop displaying a building management system dashboard with a map illustrating building layouts, along with statistics for workers, supervisors, temperature, and humidity, and filter options on the side.

Visibility

  • Headcount during emergencies

  • Exit and entry into hazardous areas

  • Data backed claims

  • Insight into environmental data

A laptop displaying business data dashboard with charts and graphs.

Productivity

  • Live task(s) progress

  • Productivity reporting

  • Under utilization and resource allocation

  • Movement patterns

A laptop screen displays a building floor plan with security and safety alerts highlighted, including critical and warning notifications.

Safety

  • SOS button / fall detection

  • Reduce overcrowding areas

  • Enforcing healthy work environments

  • Evacuation headcount

Your site. Your data.

Construction workers and workers waiting in line at a construction site, wearing hard hats and safety gear, with high-rise buildings and cranes in the background.
See Use Cases

Uncover trends and spot inefficiencies

Drive continuous improvement with historical movement paths combined with area utilization data.

With fully customizable dashboards and reports, you’ll track what aligns most with your site’s goals, KPIs, and operations.

Get in contact with an expert
image of data and stored in the cloud
"Icon of four interconnected circles on a dark blue background."
construction icon with building blocks
Speedometer icon with white outline on dark blue background

Construction optimised

Accurate, durable, and designed to last on any construction site

Turnkey provider

End-to-end provider of hardware, software, and services

On-premises or cloud

Flexibility to meet your security and deployment needs

Fast installation

Go from idea to implementation in just weeks

  • Aerial view of a modern hospital complex with multiple white buildings, parking lots, and surrounding landscape under a cloudy sky at dusk.

    Odense University Hospital, Denmark

    Area utilization combined with zone temperature saved 30% compared to the previous winter.

  • Aerial view of a large modern hospital complex surrounded by construction and green landscape with ponds.

    Odense University Hospital, Denmark

    Zone-level tracking cut cost and boosted output across 22 Kilometers of Corridors.

Press

How Construction Management Technology Saves Time and Money 

Read more

April 16, 2025

SPARK Microsystems and TokenMe Partner to Transform Safety and Efficiency on Construction Sites 

Read more

July 30, 2025

CES 2024: AI-powered TokenMe Redefines Large-Scale Construction at ..

Read more

January 8, 2024